- Published on
A Data Experience Worth Paying For
- Authors

- Name
- David Krevitt
- Link
- Data App Enthusiast
- Get in Touch
Table of contents
- But first, what is a data experience?
- Why build a data experience?
- Avoiding data experience sprawl
- A data experience worth paying for
But first, what is a data experience?
The term data experience is broad enough to be meaningless! So let’s get specific and dive into examples.
Data means analytics data (showing counts of events or entities) + the output of machine learning or heuristic-based models (for recommendations or personalization).
Experience means that this data is embedded within a parent application (as in user or customer experience), as opposed to served within a business intelligence tool or notebook.
We'll focus here on two common types of data experiences:
Embedded analytics in a customer-facing SaaS application: where data is embedded to support usage of the core application.
Examples in the wild: dashboards for AWS, Twilio, Mailchimp, etc.
 Credit: Twilio
Vertical-specific data applications, which can serve either internal users or external customers: where taking action from data is the core purpose of the application.
The most obvious examples exist in finance, accounting and ops, where data applications are often built to replace spreadsheets, but there is a very long tail of vertical-specific data applications across industries like healthcare, manufacturing, telecom, financial services, etc.
Examples in the wild: Clari, Mosaic, SELECT.
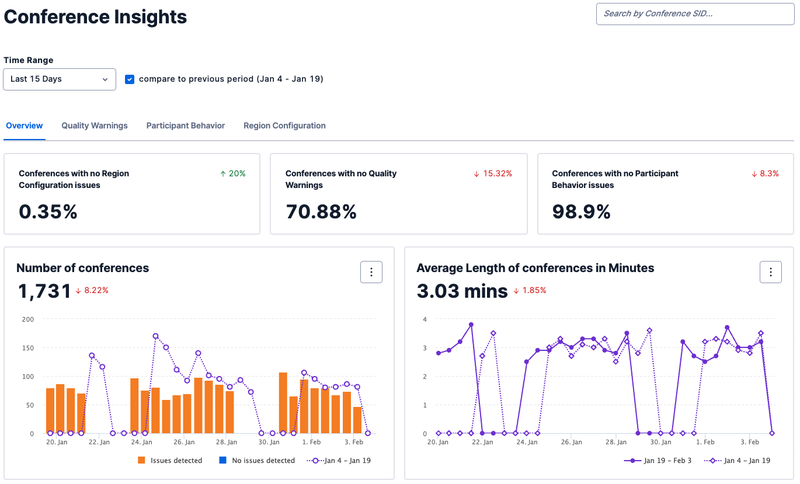
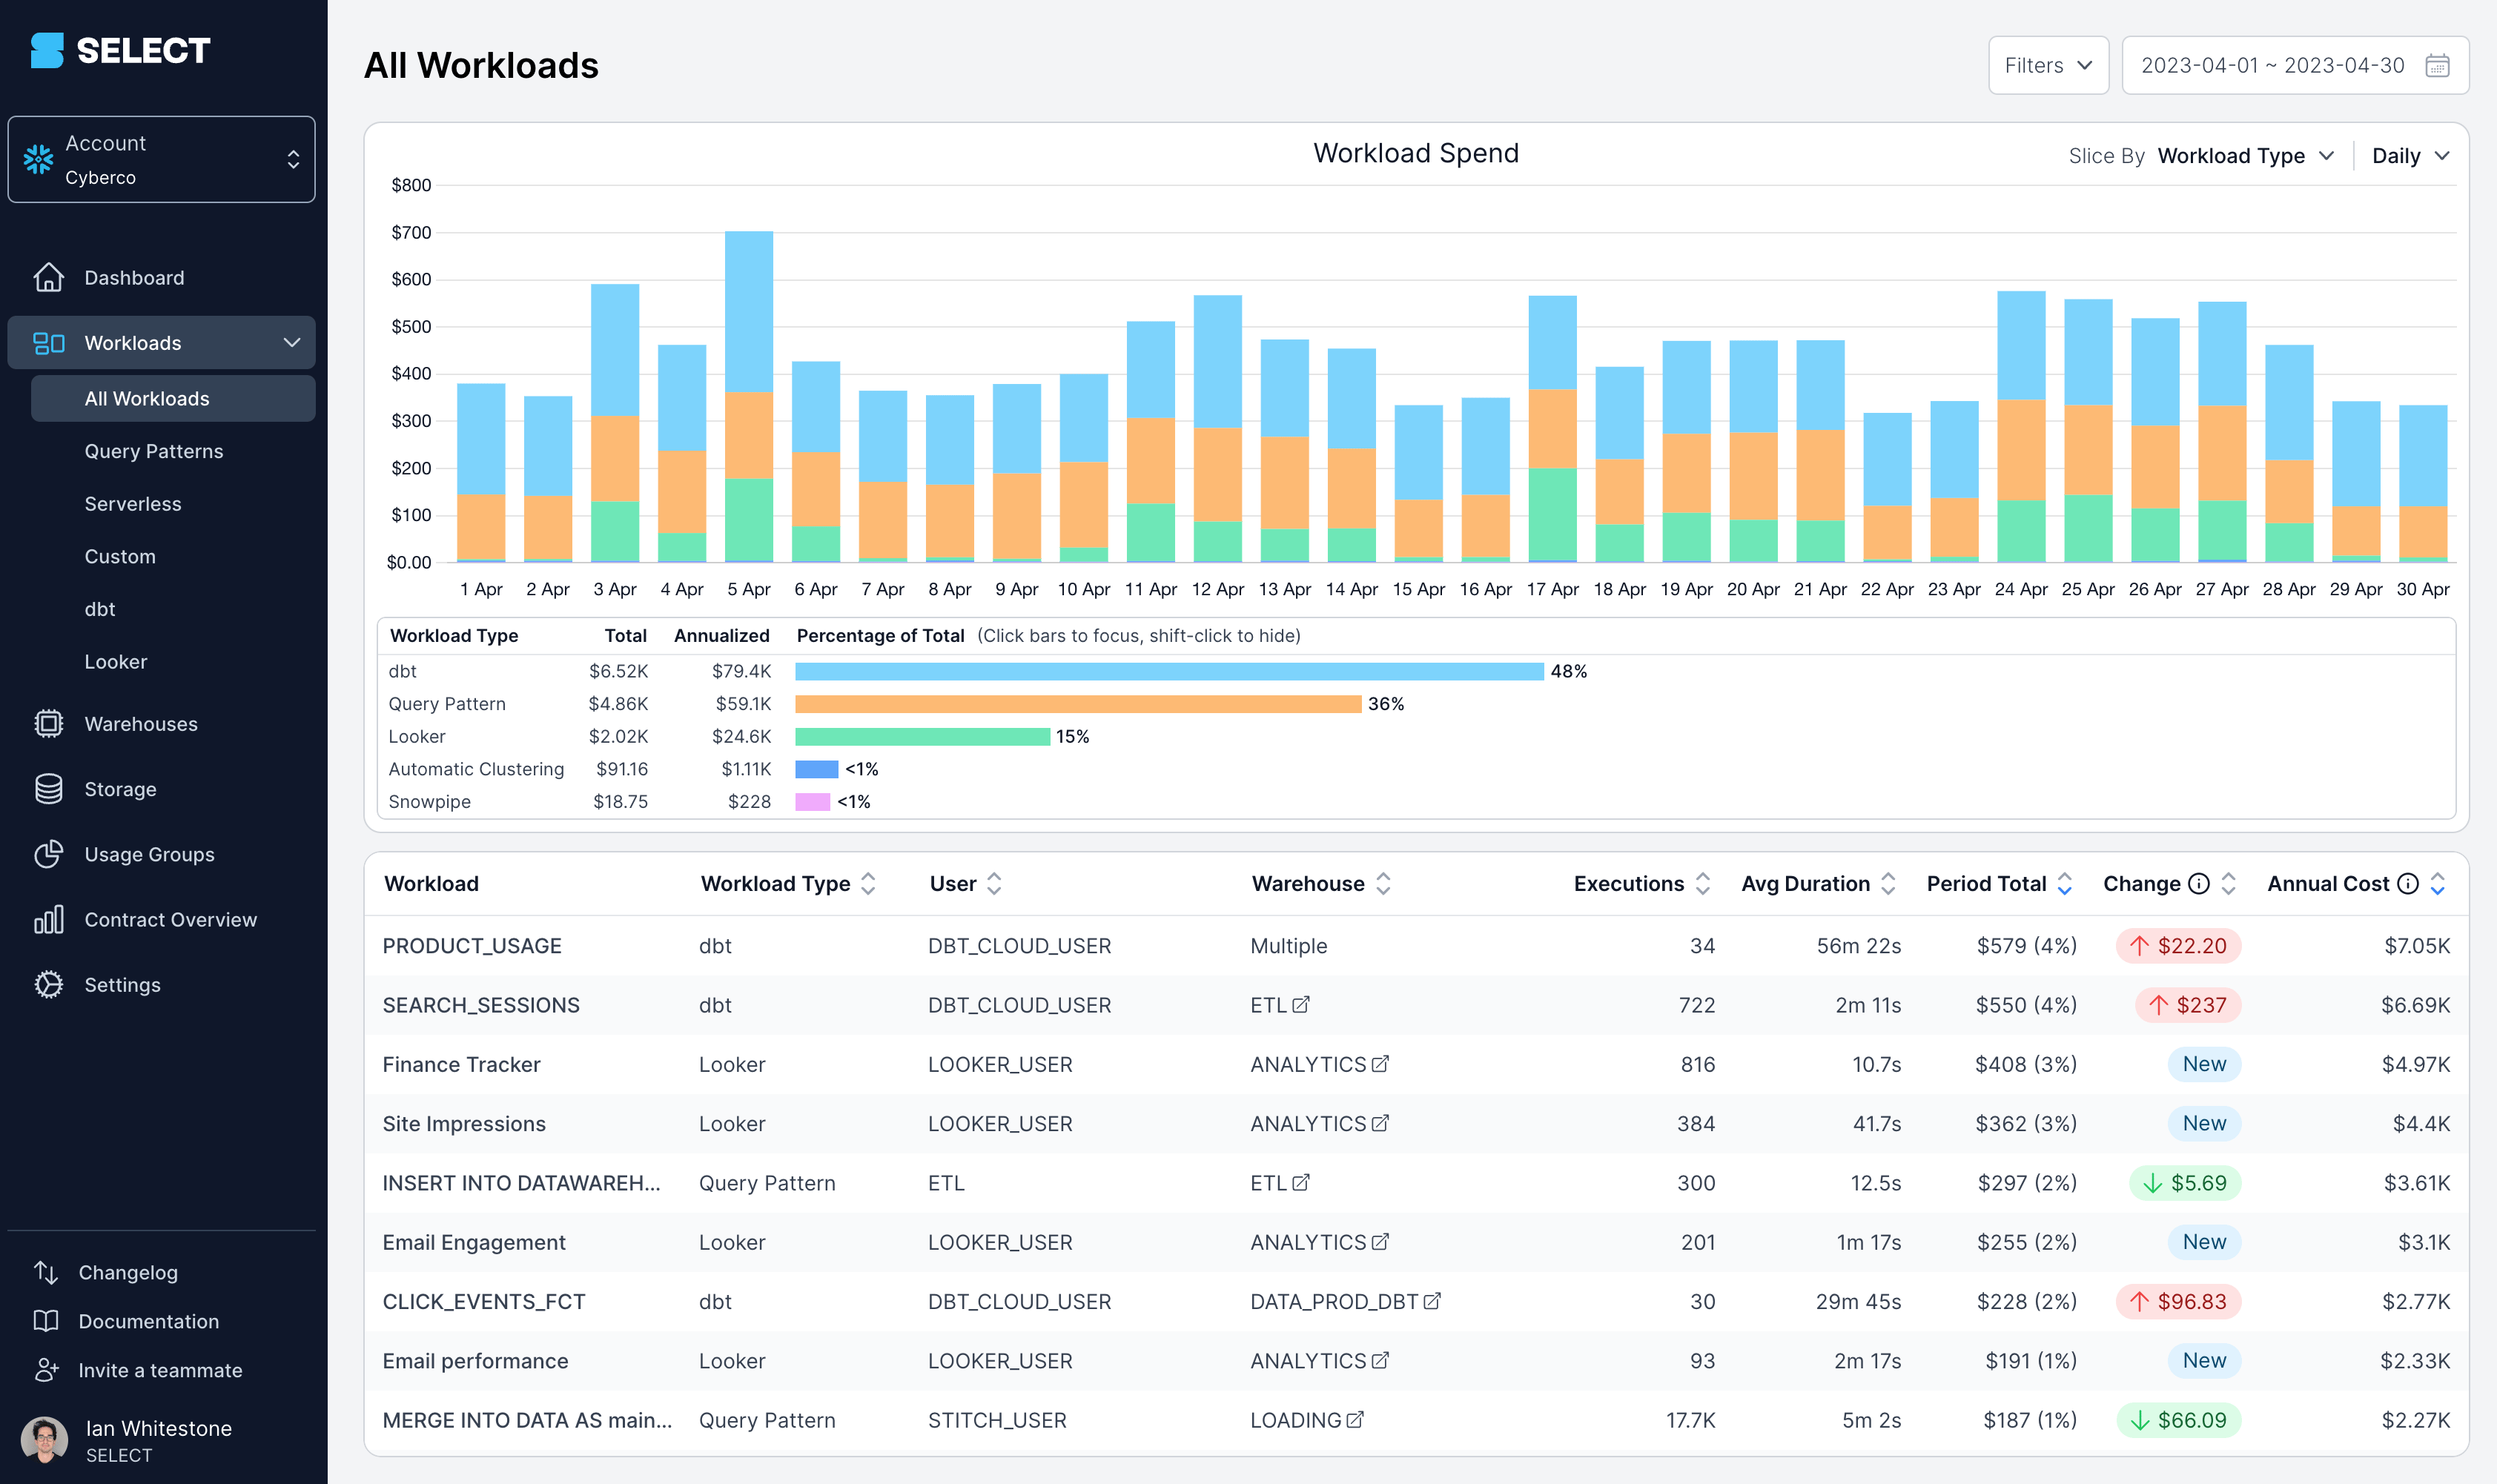 Credit: SELECT
Because data experiences live within applications rather than BI tools or notebooks, building them requires bridging the worlds of data engineering with those of "traditional" software engineering and user experience design.
[ the data experience discipline overlap - a 3-way venn diagram between data engineering, software engineering and user experience design ]
This makes them inherently more costly, in terms of infrastructural complexity + human attention - so why bother?
Why build a data experience?
This may be a hot take, but we'd argue that it's only worth investing in a data experience within your application if users are willing to pay for it (or fund it with budget in the case of an internal app).
This is most obvious with a vertical-specific app: it would cease to exist without the backing of customers or internal champions.
A vertical-specific data app may begin life as a data tool (eg a notebook or spreadsheet) rather than an application, and be expanded into an application by virtue of necessity (to acommodate requirements for larger data size, speed or security). This makes them more of a known known, a "consulting problem."
On the other hand, the business case for embedded analytics within a SaaS app is much more nuanced, interesting, even murky. A few revenue-attributable paths you could consider:
The box check (defensive approach): if you've lost customer accounts or partners due to a lack of embedded analytics, and they have a genuine case for how they'd use that data, what are you waiting for?? Fire up that data backend and get moving on something simple, but keep the customer or partner honest by checking usage as you start to ship.
The usage booster (offensive approach): if your product serves broad use cases (multiple features or products), then monitoring dashboards present an excellent opportunity to cross-sell or suggest relevant features for a given account.
The enterprise "advanced analytics" SKU (offensive approach): if more sophisticated customers are asking for advanced analytics (queries your current dashboard or API doesn't serve), you may have the opportunity to package analytics either as an Add-on SKU or as part of an existing Enterprise package.
If you first define your why for providing a customer-facing data experience, rather than just throwing a dashboard into your product "just because," you may be able to significantly cut down your scope, introduce a new revenue stream, or both.
Analytics APIs: The minimum viable data experience
The best data experience is the one you don't have to build.
One reason embedded analytics dashboards within most SaaS applications or cloud services (ahem, AWS) are so bad, is that the most sophisticated customers prefer to just ingest the data via API into their own systems, and roll their own reporting + monitoring tooling.
This is wonderful, but! Keep in mind a couple risks to providing API-only data access:
- It's a box-check, a defensive play: unless you're charging directly for access to your API (or packaging it as part of a higher tier), you won't be able to leverage the data experience to drive usage + revenue.
- The data backend to serve that API is >75% of the work, and creates all of the leverage required to build an excellent UI (building web components to visualize data from an API is a "known known" pursuit). You may be leaving money on the table by not going the last mile.
That said, it's all about understanding the user requirement, and working backwards from there to meet it. Feel free to think outside the dashboard when designing data experiences.
Avoiding data experience sprawl
There's one primary trap to avoid when building a data experience.
Data experience sprawl, is an old friend from the world of internal reporting, where companies-that-will-not-be-named somehow end up with thousands of dashboards for hundreds of employees.
Dashboards are like Pringles - once you pop, you can't stop.
That one screen or set of queries not quite hitting right? Let's add some more! Once you have the data backend + component library in place, it's pretty easy to add new cuts to the frontend.
This is a trap, because every new data-rich chart, table or screen you add to your application creates additional cognitive load on users. Each new component dilutes the efficacy of the existing components.
A few ways to avoid this:
Practice 1-in, 1-out
Because of the risk of analytics sprawl + the size / density of data components, real estate in a data experience is precious. If you've had a feature request (either from users or internally) to add a new component or page, attach the removal of a no-longer-needed component or page as part of shipping it.
Segment by persona
If your application has non-overlapping user personas (by job function, role level, or job-to-be-done), bifurcate those experiences into separate pages or groups of components, rather than shoehorning them into a single experience.
Practice chaos removal
Implement product analytics on your data experience, focusing on engagement (tooltip hovers, filter clicks, date range navigation). Periodically, remove components (or even entire data experiences) that that are seeing limited engagement.
If users ping support asking where that view has retired to, you now have signal that it matters! But if users don't care, you shouldn't either - and now you've freed up valuable real estate (and backend compute + maintenance budget) that can be used for more valuable data experiences.
A data experience worth paying for
Even if you're providing a data experience for free, users still have high expectations.
If your internal ops team has to wait 10 seconds for an analytics report to load, they’ll take a minute, check Slack or their phone, and all will be ok.
If your customers have to wait 10 seconds for a page within your application to load, they’ll think it's broken, and that distaste will extend to your application (or brand) as a whole.
If your internal users have to wait 10 seconds in the field for an operational app to load, they might miss an opportunity to address a pressing issue.
But providing an appropriate-latency data experience can be expensive! Navigating the tradeoff between cost and latency becomes critical when building a user-facing data experience - most of that work falls ultimately on the data backend rather than the frontend.
This is why we advocate for monetizing data experiences (whether directly or indirectly) - to provide sufficient capital to build an experience your users will love.
Operating with margin
For an internal data platform, cost is distributed across teams + workloads. Very large organizations may bill back to specific user groups + cost centers, but generally the bills are monitored at an aggregate level, and each individual query or workload is not scrutinized.
But in a user-facing data experience, it’s critical to maintain healthy unit economics across your customer base.
Given the highly variable nature of data size (depending on use case + access patterns), the costs of underlying data infrastructure (storage + compute) could vary widely, and risk turning your P&L upside down.
If you're interested in digging deeper on this topic, reach out! We're actively doing research on how to build + operate profitable data experiences within applications.