- Published on
Evaluating Vertical-Specific Data App Ideas
- Authors

- Name
- David Krevitt
- Link
- Data App Enthusiast
- Get in Touch
In terms of building data experiences users are willing to pay for, vertical-specific data applications are the straightest path to monetization.
- Bring your opinionated take on how to execute a business process using data.
- Build an application to allow others to execute it.
- Profit.
I'd argue that this directness makes them dangerous: it seems like a tantalizing attainable way to transform your expertise (whether personal or organizational) into recurring revenue.
But it's not without risk - there is no magic wand (yet!) that transforms business logic into an application, no magic wand that deals with the cruft required to take any application to market, no magic wand for marketing, support, etc.
Building + marketing vertical-specific data apps requires the same amount of discipline as any software product.
Trust me - I've failed more than I've succeeded in building vertical-specific data apps, and have incinerated plenty of personal capital along the way, so this post contains hard-earned personal lessons.
This is the post I'd wished I could've read before getting into the data application business: a set of tests to evaluate data app ideas.
Table of contents
- What's a vertical-specific data app?
- BlackRock Solutions: The runaway data app success you've never heard of
- Aladdin's humble beginnings
- Scaling to external clients
- 5 tests to evaluate a data app concept
- Have a strong point of view, expressable in data
- Focus on a durable process
- Validated with a manual process or spreadsheet
- Serve a niche market, with consistent anchor datasets
- Have an anchor client
- Grading my own data app
- Exploring your own ideas
What's a vertical-specific data app?
An application whose core purpose is to take action from data.
Use cases for data apps can be broken down by the timing of actions they support:
- Act in the future: forecasting + scenario planning For example, Mosaic, which allows finance teams to execute budget planning across an organization.
- Act now: monitor + administer complex systems. For example, SELECT, which allows data teams to monitor + control Snowflake spend.
Vertical-specific data apps, as opposed to horizontal (general-purpose) applications, are tightly bound to a specific user persona + use case. Solving for a specific administrative job-to-be-done requires an end-to-end understanding of the process: data source selection, data modeling and action design all depend on having previously done the job in some form.
This is why they're tantalizing opportunities for organizations or individuals with expertise: process knowledge is the blocker, rather than any specific technical expertise on the data or software engineering side. The goal is to express your point of view through data + process, not to invent any fundamental technology.
I've noticed that successful vertical data apps generally meet 5 criteria:
- Have a strong point of view, expressable in data
- Focus on a durable process
- Can be validated with a manual process or spreadsheet
- Serve a niche market, with consistent anchor datasets
- Have an anchor client
Let's get into each of those, by digging into one of the most successful vertical data app businesses ever built.
BlackRock Solutions: The runaway data app success you've never heard of
BlackRock is the largest asset manager in the world, and BlackRock Solutions (BRS) is their technology arm. Amazon:AWS :: BlackRock:BRS.
BRS provides a suite of data applications for portfolio + risk management, collectively known as Aladdin, that they sell to other finanicial services firms (asset managers, insurance companies + reinsurers, banks, etc).
The Aladdin platform was productized from internal applications that BlackRock built to manage typical asset management processes (trading, risk management, settlement, compliance, client reporting, etc).
Aladdin's humble beginnings
But in the early 90s, BlackRock (founded in 1988) was a relatively small bond fund manager, and BRS was nothing but an idea.
One person, the late Charlie Hallac, had the seed of an idea in his mind: what if we offer these internal applications to external clients? BlackRock Solutions was born.
What they delivered first (their first "data app") was known as a "Green Package": a daily statement of a fund's asset positions + risk profile (duration, convexity, etc) at the start of a trading day. It helped traders "act now" and decide on what trades to make throughout the day, to maintain their fund's target risk profile.
Internally at BlackRock, these were printed out each morning by the analytics team, and hand-delivered to each portfolio management desk.
Green Packages were fed by an overnight batch analytics workflow, that ingested data from many financial data feeds and calculated risk on a portfolio (which would then be manually QC'd by a person with market understanding). Sometimes the data feeds would arrive with errors or ommissions, and would require getting on the phone (!!) with a vendor overnight.
Packages had to be on the trading floor well before market open: in addition to the overnight team who put packages together, analysts had to be in the office at 6:30am each day to review + deliver them. Years later, I was one of those analysts.
Scaling to external clients
This whole process was laborious and unrelenting, even when the entire workflow took place inside a single building in Midtown Manhattan. How would this possibly scale to globally distributed external clients?
To test their ability to scale, they attempted to do 5 dummy implementations at once. If they could do 5 implementations in parallel and support them in daily production, they'd be ready to scale up selling Aladdin + the Green Package service to external clients.
Apparently it worked out, because 3 decades later, BlackRock's technolgy division did ~$1.364 billion in revenue, on which they earn roughly 30% margin.
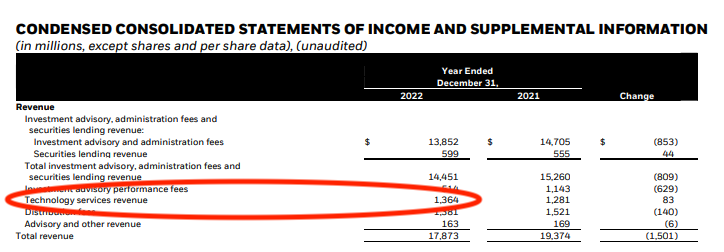
Source: BlackRock Q4 2022 Earnings Release
So what did they do right?
5 tests to evaluate a data app concept
Have a strong point of view, expressable in data
As a fund manager, BlackRock was a leader in mortgage-backed securities, and had developeed proprietary models to forecast prepayment risk on pools of mortgages. External clients, many of whom were competitors to BlackRock as asset managers, wanted access to the output of BlackRock's risk models, which were accepted as the gold standard.
BlackRock had the wisdom to bet that selling access to the output of their risk models wouldn't prevent their own portfolio management teams from being succcessful, given the breadth + depth of global markets.
Focus on a durable process
Front, middle and back-office processes for asset management have been remarkeably consistent over time, since they're mostly governed by securities law - so the applications one builds to serve them don't need to change much over time.
Paraphrasing from Jeff Bezos, focus on the things that'll stay consistent: customers will always want low prices and fast delivery.
Managing the positions + risk of a trading book is never going to go away - this was probably why numbers and paper were invented in the first place.
Validated with a manual process or spreadsheet
Green Packages were QC'd by an analyst, slowly scrolling with a ruler down pages of legal size paper to validate risk metrics based on their market knowledge. Doesn't get much more manual than that.
Serve a niche market, with consistent anchor datasets
BRS first focused on serving clients that looked like BlackRock: US bond fund managers. This allowed them to focus on a small number of risk models, which required a bounded set of data feeds from a handful of vendors. This boundedness kept margins up, despite the labor-intensive delivery process.
They only branched outside of that core segment after finding traction, and after BlackRock itself branched out into other asset markets (thus requiring BRS to build the infrastructure to support those markets internally).
Today, BRS serves pretty much any portfolio type, anywhere in the world - but it took probably 20 years to get there.
Have an anchor client
BRS's largest client is still BlackRock, same as AWS's must be Amazon.
Prior to selling externally, internal BlackRock funds were already paying for the Aladdin platform, in the form of management fees dedicated to paying for technology services.
This internal customer relationship allowed for a very tight feedback loop between frontline users (traders, portfolio managers, etc) and the development + analyst team, which still endures today.

Source: Forbes - BlackRock's old HQ on E. 51st St. in Manhattan.
Grading my own data app
If BRS is what success looks at on the far end of the spectrum, let's evaluate an application closer to the starting gate: TrafficProjection.com, a data app serving digital marketing agencies + consultants. Myself and a partner launched it in November of 2023, and as of writing it does $4k in MRR - so some traction, but still very early days.
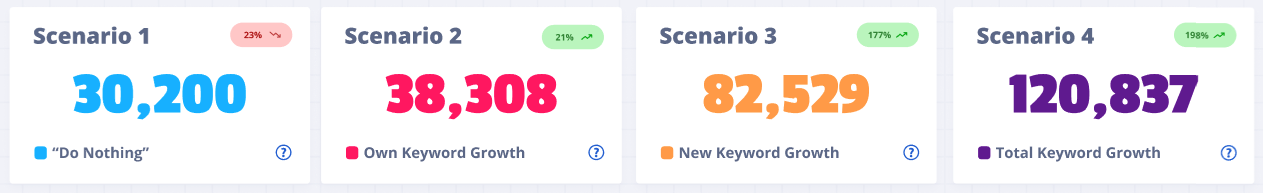
It allows those marketers to plan how they'll act in the future (vs right now), by forecasting what the projected organic traffic from a content campaign might be 12 months in the future.
These projections are embedded into a proposal + pitch, and sold to a client as a service package. After a client signs, the forecast becomes the starting point for a project plan.
It's a simple application, that solves an immediate data analysis problem at a critical point in the agency sales lifecycle. How's it stack up against those 5 criteria?
Strong point of view, expressable with data: ✅ The process was iterated by myself + my partner Ryan, as a means of estimating organic traffic from a content campaign as part of an agency sales process. Ryan brought process knowledge (as his agency sells + delivers SEO services), I brought knowledge of the underlying data sources (web analytics + keyword data) + forecasting methodologies.
Durable process: 🤔 This one is a mixed bag. If you would've asked me a year ago, the answer would be a resounding yes: as long as there are search engines, there will be the need to predict the traffic one could garner via search engines. But given the "SERP noise" brought about by ChatGPT, Google SGE, and general chat-assistant adoption, durability is an open question - this is true more broadly for marketing as a practice.
Medium-term, I don't think "organic search" is going anywhere, but for long-term durability we may want to zoom the niche out a bit (to track evolution of the SEO industry as a whole).
Manual validation: ✅ We launched the Traffic Projection Tool in 2018 as a free Google Sheets template, and it picked up significant traction in the digital agency community:
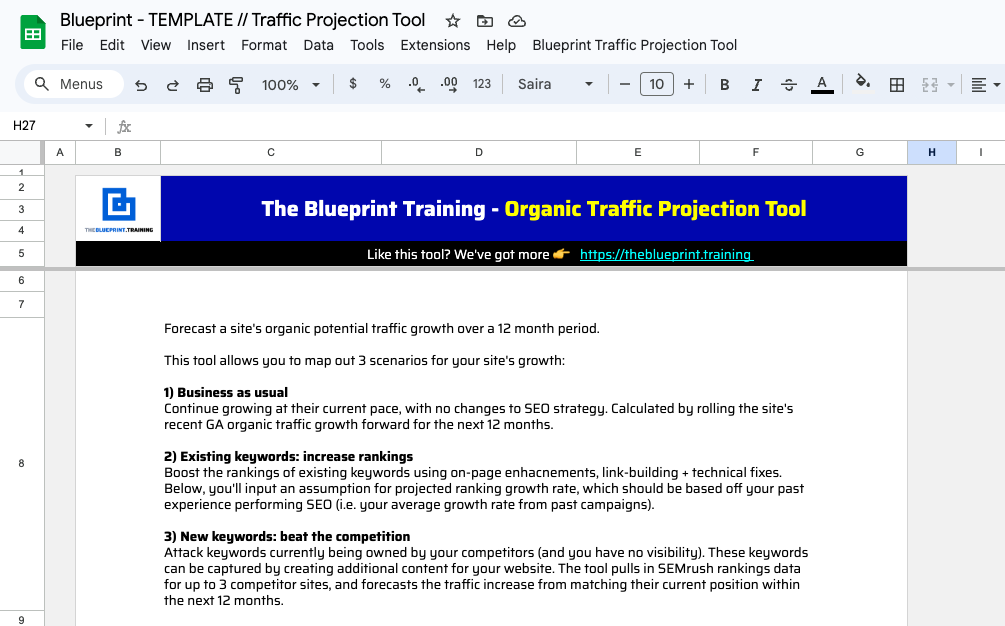
This gave us enough confidence to sell an upgraded paid version of the Sheets tool, before eventually refactoring it into a SaaS application.
Niche market, with anchor data sources: ✅ The digital agency / consultant market is quite distinct from in-house marketing in terms of jobs-to-be-done. Sales + client management is much tighter: you have to justify what you'll do + do it, versus getting the chance to own a broader portfolio over time.
Data sources used are a keyword tracker (SEMrush / Ahrefs) + web analytics tool (Google Analytics), and those anchor tools have been quite consistent over time.
Anchor client ✅ I built the original version of the TPT for Ryan's agency (WEBRIS), who have been the heaviest users throughout its journey from spreadsheet -> SaaS.
--
In a couple months since launch, the Traffic Projection Tool has hit $4k of MRR - not yet a huge business, but a solid start + validation that we've positioned against the niche correctly.
Future growth will come from:
Broadening out coverage of the process cycle: TPT is fundamentally a digital agency sales tool, so could cover more of the process (generating proposals, vs just forecast data, or managing the handoff between sales + client onboarding).
Broadening out marketing campaign types: supporting forecasting for paid campaigns, or hybrid paid / organic (rather than just organic content). As for BRS, this expansion will likely be driven by what Ryan's agency is doing in the field (to maintain our point of view + anchor client advantage).
Exploring your own ideas
Does your organization have the potential to build a BRS-like data application platform business? Do you personally have the potential to build + market a data application as a lifestyle business?
The only way to know is to rumble through the desk drawers of your operational workflows: what data assets do you use to repeatedly drive processes that result in postiive business outcomes?
What works so well that you've forgotten that it exists?
Trust me, that spreadsheet template, dashboard or internal tool that you + your team find to be boring is exactly where opportunity lies. The best vertical-specific data apps are powerfully boring.
Boring = understandable by external customers. Boring = maintable at high margin.
When you find something boring, ask yourself the 5 questions. Does it have a strong point of view, durable process, manual validation, niche market, a prospective anchor client?
If you can answer "yes" to the 5 questions, you might be on track to build your own business unit in the mold of BlackRock Solutions, or just a nice recurring-revenue-generating data app side project. Either way, there's a good chance it's worth pursuing further.
If you're ready to get going, or have an existing data application that you're looking to grow, get in touch! I'd love to hear your story.