- Published on
Forecasting a Website's Organic Traffic
- Authors

- Name
- David Krevitt
- Link
- Data App Enthusiast
- Get in Touch
Welcome to Cacheworthy
This post is a vestige of this blog's previous life as CIFL (2015 - 2023), which covered building analytics pipelines for internal reporting. When migrating to Cacheworthy and a focus on data applications, we found this post too helpful to remove - hope you enjoy it!
Curious about data applications? Meet Cacheworthy.Of course reality never plays out as you forecast it - BUT - having a solid framework for thinking about potential scenario paths will make life easier for colleagues or customers. They’ll thank you for working to soothe their anxiety.
So let’s investigate a common source of online business stress:
What could my website’s organic traffic be in a year?
The answer to that question will drive a decent chunk of planning efforts for an online business: potential revenue, hiring, comp, you name it.
To help answer it, we built a template that does some basic forecasting math in Google Sheets (using data from Google Analytics + SEMrush) and summarizes the findings into a 5 page Google Data Studio report.
It’s an approach that’s specifically designed to help SEO agencies when pitching new clients, but you could adapt this forecast methodology for any project.
Let’s dive into the nitty gritty of how we implemented these 3 for the Traffic Projection Tool.
- Top-down vs bottom-up forecasting
- Communicating your forecast scenarios
- Bake repeatability into your forecast
- Putting it all together
UPDATE: This forecast model was originally built in Google Sheets + Data Studio, which was great but could be cumbersome to setup. It's now available as a standalone SaaS tool called the "Traffic Projection Tool": check it out here.
Top-down vs bottom-up forecasting
Let’s first define what we mean by these two.
Top-down forecasts take some broad macro trend, like top-line revenue growth, and forecast forward based on that trend. All of the subcomponents of revenue (COGS, gross profit, etc) are then calculated based off of that top-line forecast.
Bottom-up (aka ‘sum of the parts’ forecasts) look at the trend of each individual component, and then sum them up to forecast how the whole entity will move.
For this traffic forecast, we used a combination of bottom-up and top-down forecasting:
- Top-down to map a “Business as Usual” scenario by calculating your site’s current organic traffic growth from GA, and rolling it forward 12 months:
Monthly traffic = traffic from the same month last year * last quarter’s YoY growth rate
- Bottom-up to define potential keyword-level paths to traffic growth, whether by boosting your existing keyword rankings or by going after new keywords:
Monthly traffic = sum of (keyword-level ranking * assumed CTR for that position * search volume)
Since we had access to both top-down and bottom-up datasets, we decided to combine the two.
But in your own forecasting work your methodology choice may be confined by what data you can access.
Communicating your forecast scenarios
If people can’t understand how you built out a forecast, they won’t trust the results.
So it’s on you to communicate your forecast scenarios with crystal clarity.
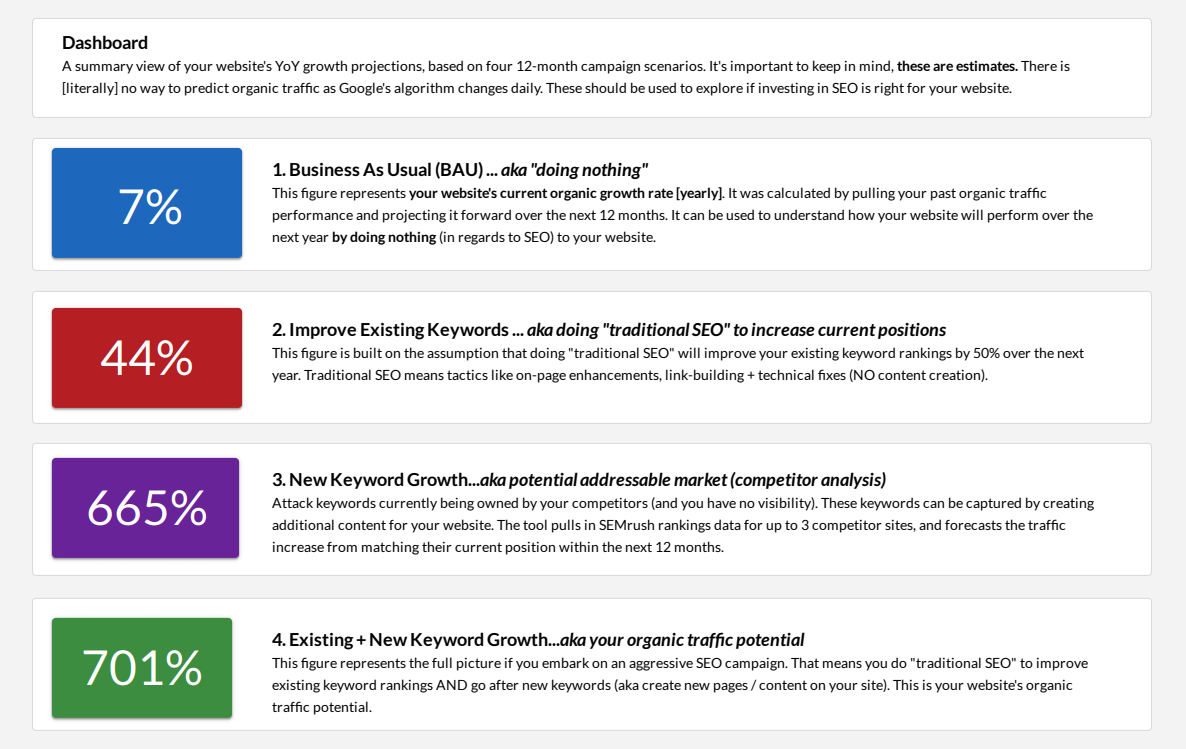
We ended up with 3 forecast scenarios:
- Business as Usual As discussed, a top-down forecast using total organic traffic from GA.
- Improve Existing Keywords A bottom-up forecast using your site’s existing keyword rankings from SEMrush, with the traffic boost coming from a 50% assumed ranking improvement over the next year.
- New Keyword Growth A bottom-up forecast using your competitors’ keyword rankings from SEMrush, with traffic picked up by matching their rankings for a list of keywords over the next year.
For the report template in Data Studio, we add written context to each chart - so that a new colleague or customer could pick up the report and read it without confusion.
Bake repeatability into your forecast
This is why we love Google Sheets.
You can build a template for tasks like forecasting, make as many copies as you like, and you know that the math will remain as originally built.
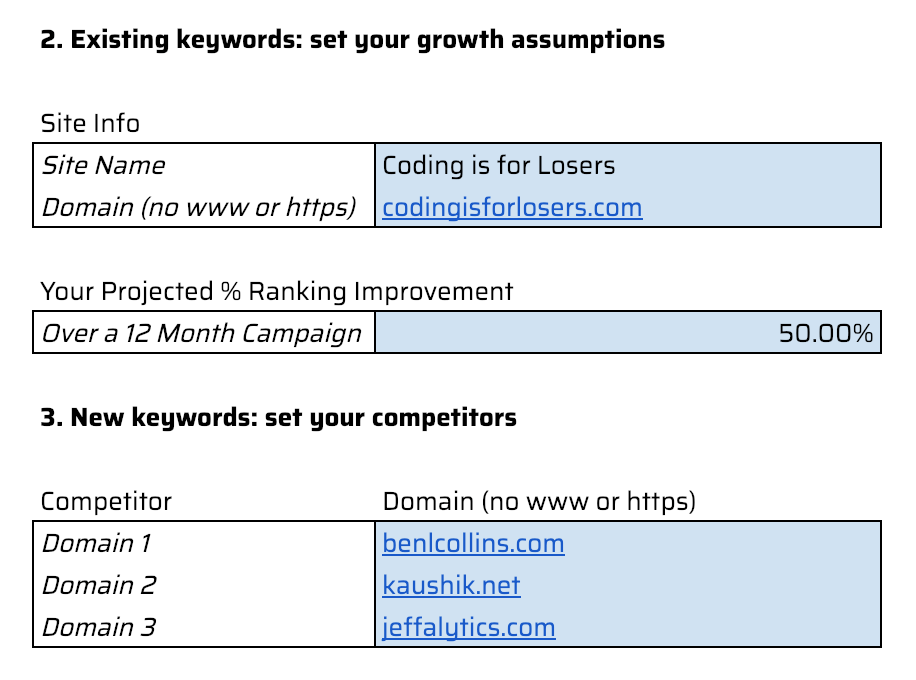
A good Sheets tmeplate always includes a ‘Getting Started’ tab containing all assumptions, so that you can quickly double-check that your assumptions are matching between forecasts:
Putting it all together
To see how these principles come together into an organic traffic forecast, check out this video walkthrough of the setup process.
Try the updated SaaS version
We originally built this model in Google Sheets + Data Studio. It worked well, but could be cumbersome to setup.
So we decided to build it into a proper software tool, that's easier to use + share amongst your team. Check out the automated SEO traffic projection tool here. Enjoy!